▶ 제품설명
AnyChart is a lightweight and robust JavaScript charting library with great API, documentation, and enterprise-grade support.
It's been developed since 2003 with one main idea - it should be easy for any developer to integrate beautiful charts into any mobile, desktop or web product. As a result, AnyChart today is a data visualization layer for thousands of great products. Our clients include both Fortune 500 companies and startups.
Our component works with any database and runs on any platform. The source code is open - you can download and edit it, it gives a great flexibility. Accessibility feature is a very important for us - we completely support Section 508 requirements. Thousands of out-of-the-box code samples in our playground, plugins and integrations, ready-to-use business solutions allow implementing industry-standard visualizations in minutes.
Developed for developers! Learn more about some AnyChart features here: chart types, customization, exporting and sharing, dashboarding, localizations.
▶ 제품기능
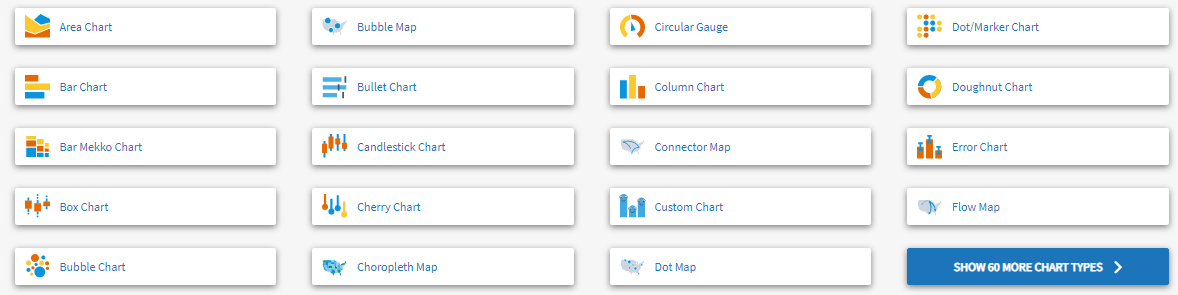
Wide Variety Of JavaScript Chart Types
AnyChart product family includes more than 79 different chart types and we're constantly adding new ones.
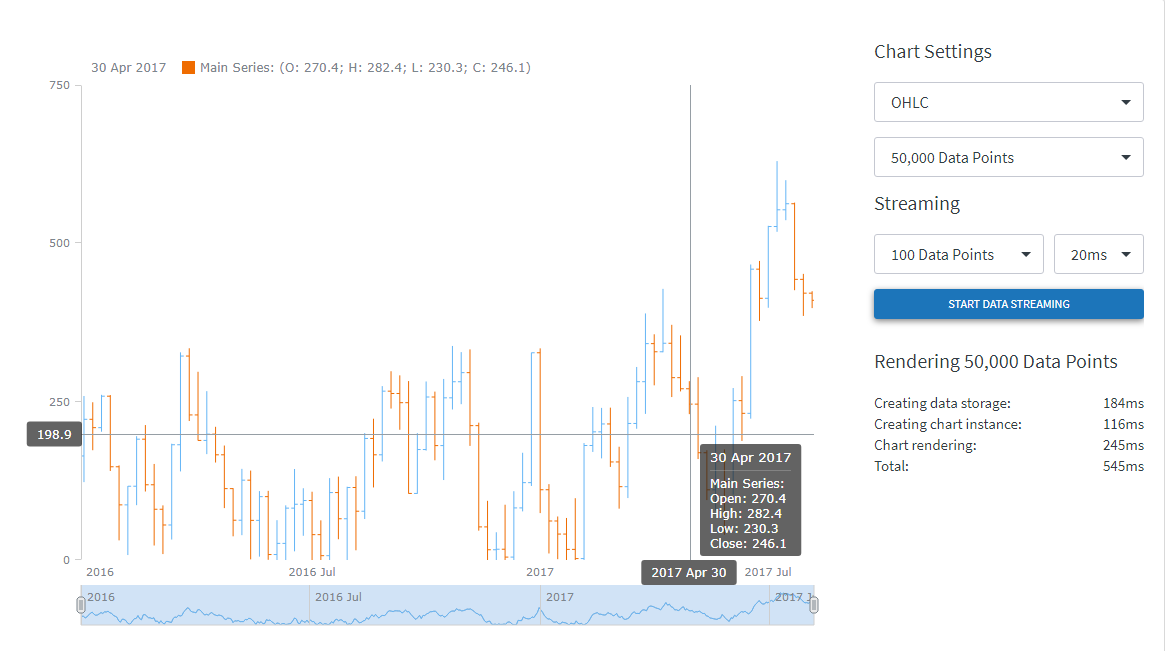
Big Data Charts
Our JavaScript charts support rendering thousands of data points in milliseconds. Run a speedtest or try real-time live data streaming.
Your Charts, Your Design
It is easy to adjust look and feel of your charts using themes and palettes - AnyChart includes set of pre-built sets or you can create your own scheme.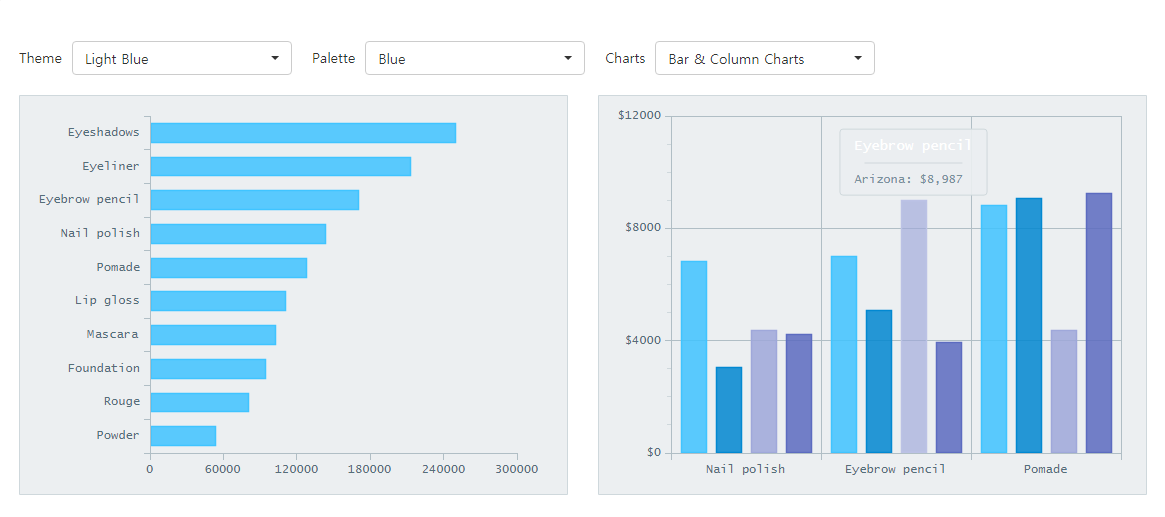
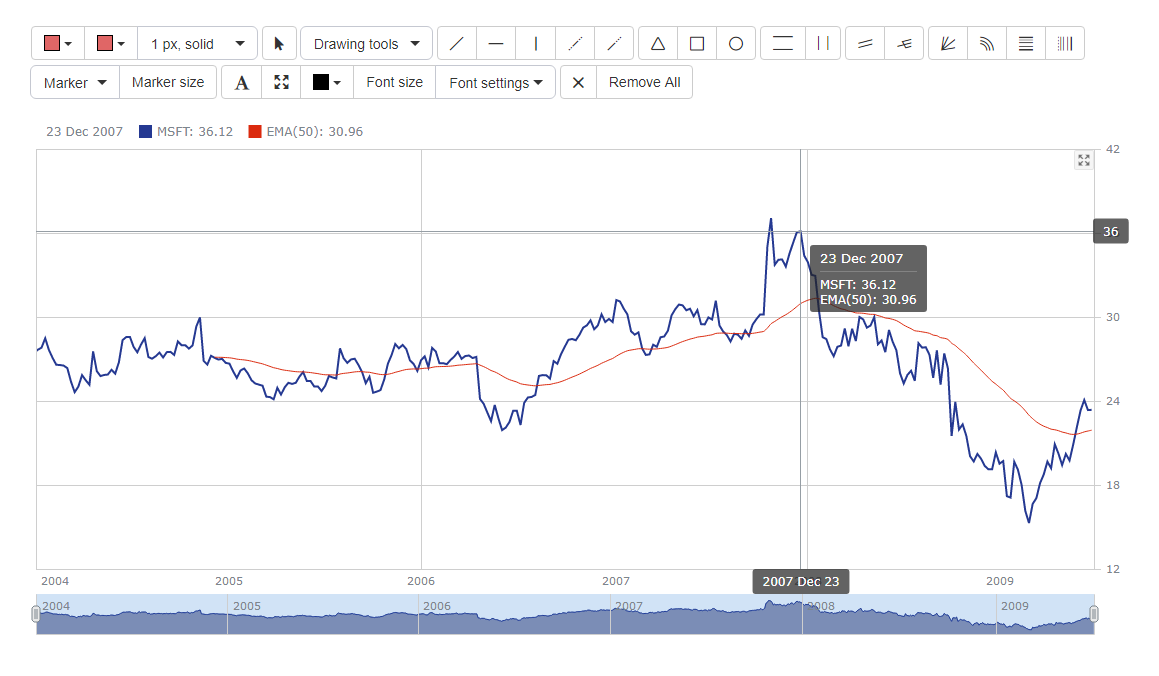
Drawing Tools And Annotations
Need to show additional information or annotations? It is really easy with AnyChart drawing tools. Try it right now!
Technical Indicators
Need to analyze your data? Our JS charts include dozens of pre-built technical indicators and you can easily create your own.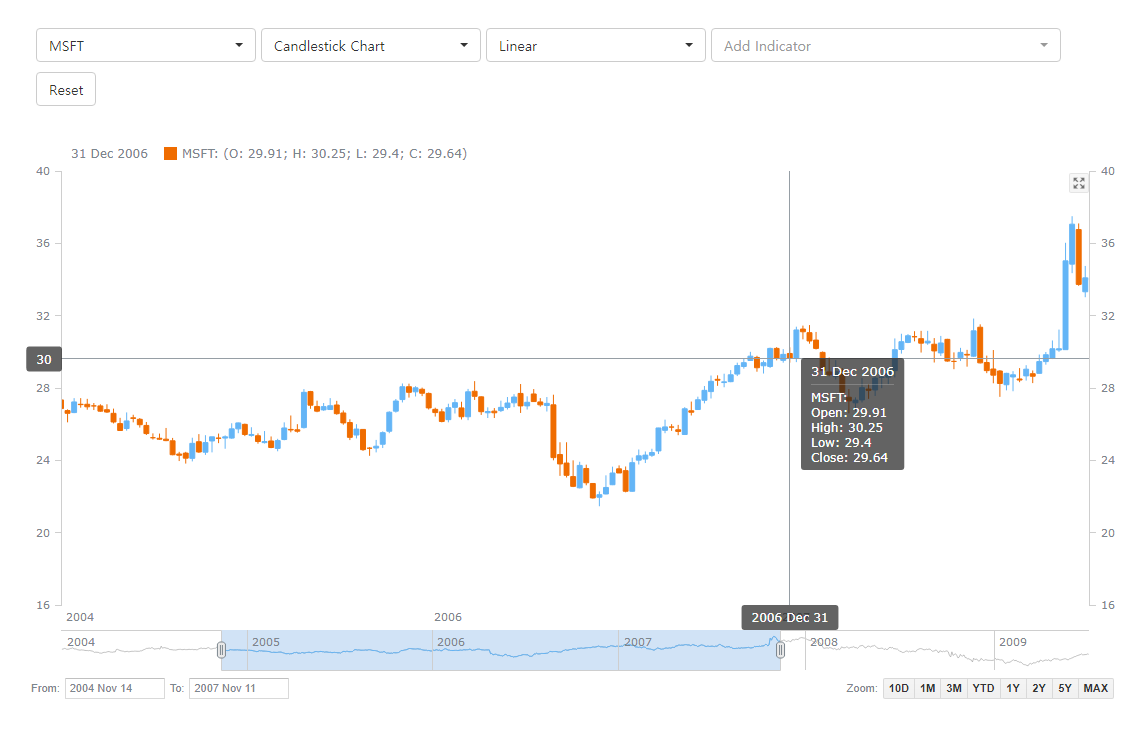
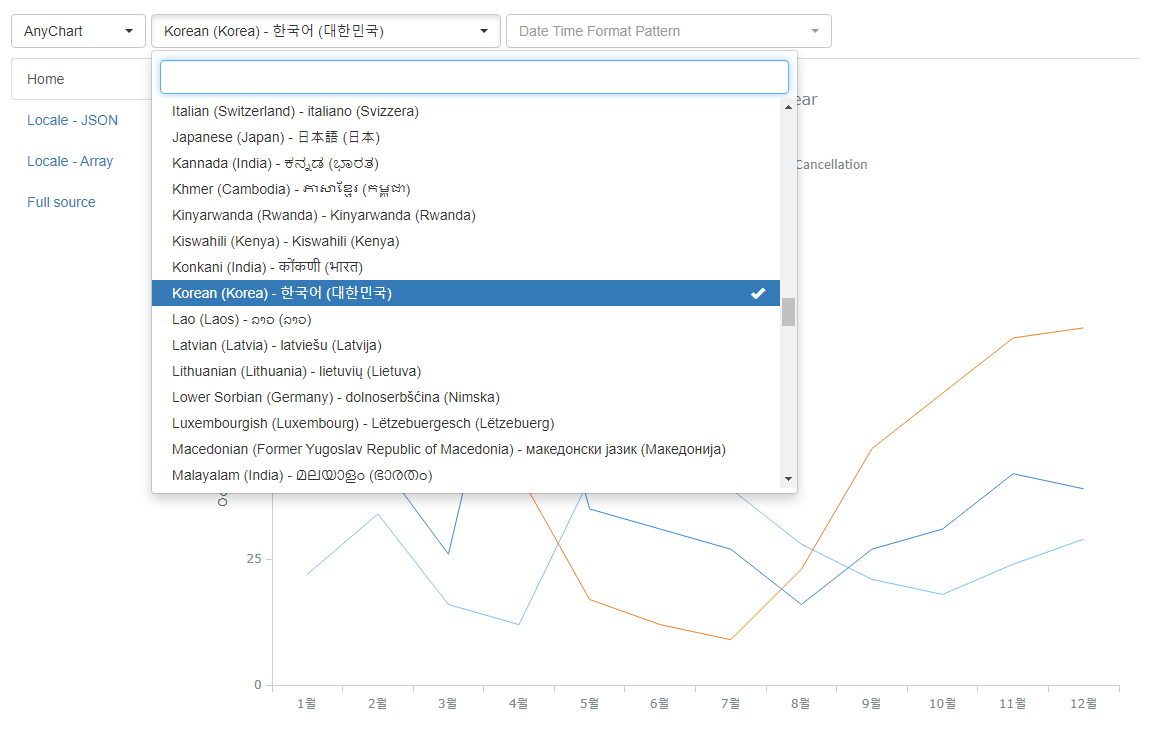
Localizations
Building international or multi-language solution? No problems - we speak any language!
AnyChart provides 194 predefined locale files, and you can build your own as well.
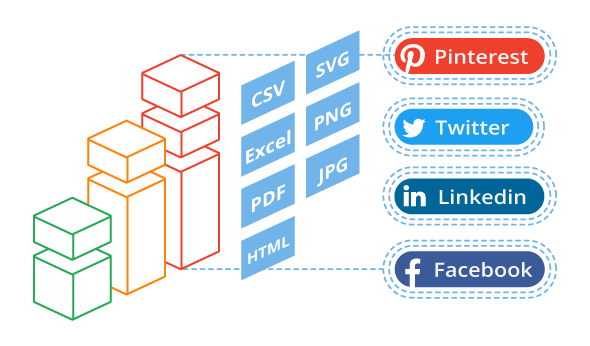
Exporting And Sharing
You can easily share a chart made with AnyChart JavaScript library to a social network like Facebook, Pinterest, Twitter and LinkedIn. Also it allows implementing custom integration with any other social network using image sharing functions. And of course, you can save a chart as an image in PDF, PNG, JPG or SVG formats or download chart data as Excel or CSV file.
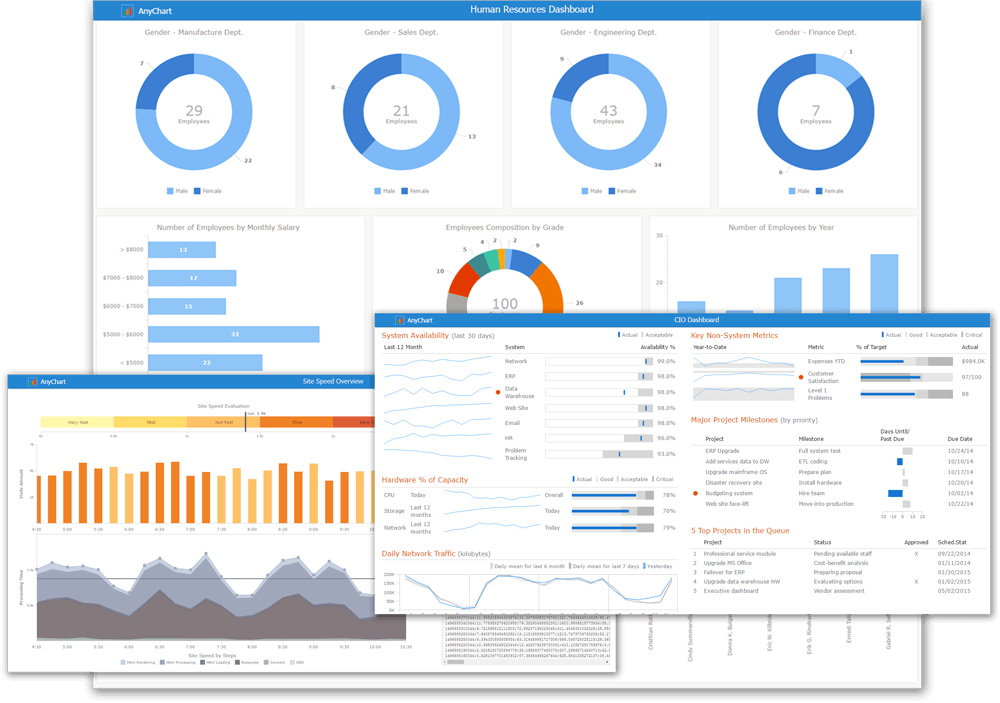
Business Solutions And Dashboards
Business intelligence dashboards arrange numbers, metrics and performance scorecards on a single screen. Dashboards help executives, management, and employees to view KPI's and assess the situation. BI dashboards help to understand the data and improve the efficiency of an organization.
AnyChart provides many sample web-applications with interactive BI dashboards. Every interactive JavaScript dashboard in these apps is created with AnyChart.
Thousands of companies already use AnyChart to create interactive dashboards. Join us and build your own!
Are you building Sales Dashboard, Site Speed Monitor, CIO Dashboard, Investment Portfolio, Human Resources Dashboard, Technical Support Dashboard? AnyChart can do this and more.
Samples For Your Stack
AnyChart can run on any platform and with any database. These samples were created to demonstrate
how AnyChart JavaScript charts can be easily integrated into your environment.


 문의전화 02-538-1423
 Microsoft
 JetBrains
 Figma
Figma Adobe
Adobe GitHub
 Docker
 Zeplin
 Autodesk
 Acronis
 DevOps
 DesignOps
 loT
loT